Official source note
DP-700 monitoring and troubleshooting is the main focus of this page, and the safest way to study it is to keep the exam hub open while you work through the official facts and the service selection patterns. Microsoft describes DP-700 Microsoft Fabric Data Engineer Associate as a certification that validates practical cloud literacy, service selection, and scenario thinking. The main Cert Pass hub remains /exams/azure-dp-700-microsoft-fabric-data-engineer-associate.
Exam facts
- Exam name: DP-700 Microsoft Fabric Data Engineer Associate
- Exam slug: azure-dp-700-microsoft-fabric-data-engineer-associate
- Vendor: Microsoft
- Cert Pass landing page: /exams/azure-dp-700-microsoft-fabric-data-engineer-associate
- Study hub: /exams/azure-dp-700-microsoft-fabric-data-engineer-associate
- Official vendor page: Microsoft Fabric Data Engineer Associate
Why this article exists
The goal here is not to collect trivia. The goal is to build the habit of reading a scenario, identifying the category, and choosing the simplest service that directly fits the requirement.
Fast study map
Use the exam hub twice during review: /exams/azure-dp-700-microsoft-fabric-data-engineer-associate and /exams/azure-dp-700-microsoft-fabric-data-engineer-associate. Those internal links should act as the stable anchor for practice, revision, and final review.
DP-700 Monitoring and Troubleshooting Guide 2026: Diagnose Fabric Pipelines, Notebooks, and Eventstreams
DP-700 monitoring and troubleshooting
Monitoring is often the difference between a usable analytics solution and a fragile one. The DP 700 exam expects candidates to know where to look when a pipeline fails, when a notebook runs slowly, when a stream drops events, or when a warehouse query becomes expensive.
The DP 700 cluster is built around Microsoft Fabric as an integrated analytics platform. The safest exam approach is to choose the simplest Fabric native option that satisfies the requirement, then validate security, monitoring, and lifecycle concerns before moving on.
Exam facts
| Detail | Value |
|---|---|
| Exam code | DP-700 |
| Exam name | DP-700 Microsoft Fabric Data Engineer Associate |
| Vendor | Microsoft |
| Question count | 50 |
| Time limit | 90 minutes |
| Passing score | 70 |
| Current prep price | EUR 29 for questions only, EUR 39 for complete prep |
| Internal cluster focus | Implement and manage an analytics solution, Ingest and transform data, Monitor and optimize an analytics solution |
Domain breakdown
| Domain | What it covers |
|---|---|
| Implement and manage an analytics solution | Workspace design, item permissions, governance, deployment flow, and choosing the right Fabric item for a business requirement |
| Ingest and transform data | Pipelines, notebooks, Dataflows Gen2, OneLake shortcuts, incremental loading, warehouse transformations, and curated model design |
| Monitor and optimize an analytics solution | Monitoring hub, run history, alerts, performance analysis, Delta maintenance, Eventstream health, and workload troubleshooting |
Start with symptoms, not assumptions
Troubleshooting in Fabric should begin with the observed symptom. A failed pipeline points to activity logs, dependency checks, permissions, source availability, and parameter values. A slow notebook points to Spark metrics, data skew, shuffle pressure, and unnecessary shuffles. A noisy Eventstream points to throughput, back pressure, and destination health. A slow warehouse query points to plan shape, statistics, filtering, and repeat workload patterns.
This symptom first approach matters because many candidates jump directly to the wrong fix. The exam often rewards the person who selects the right diagnostic source before proposing a change. That means the answer is often about inspection and validation rather than immediate redesign.
Pipeline failures
A pipeline can fail for simple reasons such as an expired credential, an inaccessible source, a schema mismatch, or an invalid parameter value. It can also fail because of downstream permission issues or because a dependency activity did not complete as expected. The best first step is to inspect the run history and the activity output details rather than assuming the problem is in the transformation logic.
If the failure repeats on new data, the issue may be input quality or schema drift. If the failure only appears on a schedule, the issue may be environmental or timing related. The exam often expects the candidate to distinguish data issues from orchestration issues and from access issues.
Notebook diagnostics
Notebook troubleshooting starts with Spark job information. Long running stages, skewed partitions, repeated shuffles, and memory pressure are common reasons for poor performance. Caching a reused dataset, reducing wide transformations, and using appropriate partitioning can help, but only after the bottleneck has been identified.
A common exam scenario asks about custom Python or PySpark logic that is correct but inefficient. The right answer is not always a different Fabric item. Sometimes the right answer is better Spark design, cleaner input shaping, or a more efficient sequence of transformations. The candidate should recognize that notebooks are both a transformation tool and a tuning surface.
Streaming and Eventstream health
Stream based workloads behave differently from batch pipelines. When events arrive slowly, are delayed, or are dropped, the important questions are whether the stream is producing too quickly, whether the destination can keep up, and whether the stream has back pressure or throttling. Health depends on both the source and the sink.
Eventstream scenarios on the exam often test whether the candidate can separate ingestion health from downstream analytics health. If events are arriving but not visible in the target, the answer may involve destination inspection, throughput review, or target configuration rather than changes to the source device.
Warehouse and Delta performance
Warehouse performance issues should be evaluated with query history and execution plans. Repeated heavy queries may indicate a need for better modeling, better filtering, or different aggregation strategy. If the data is stored in Delta tables, maintenance tasks such as compaction and cleanup can reduce file fragmentation and improve query efficiency.
The exam rarely wants a speculative optimization. It wants a targeted action based on evidence. That is why the best answer often mentions plan review, query history, or table maintenance instead of broad redesign. Candidates should also remember that warehouse tuning differs from notebook tuning and from event stream tuning.
Alerting and response
Monitoring is incomplete without response. Alerts or notification rules are needed when operators must know about a critical failure immediately. The correct answer in many scenarios is not a new data store or a larger table. It is a notification path that allows the team to respond before the issue affects a downstream report or refresh cycle.
A good support model also separates routine warnings from true incidents. If a job is slow but healthy, the answer may be performance tuning. If a job is failing, the answer may be alerting and triage. If a job is working but producing incorrect results, the answer may be lineage, logic review, or source validation.
A solid troubleshooting habit is to map each symptom to the Fabric layer where evidence lives. That turns monitoring from guesswork into a structured process. The DP 700 landing page should be the final checkpoint before another round of timed practice and scenario review.
[Start preparing on the DP 700 exam page](/exams/azure-dp-700-microsoft-fabric-data-engineer-associate)
Open the DP 700 landing page for practice and prep
Start preparing on the DP 700 exam page
Open the DP 700 landing page for practice and prep
Extended official revision notes
DP-700 Microsoft Fabric Data Engineer Associate - Compressed Exam Course
Built from the provided practice CSV/question bank (1050 questions) and consolidated into original revision notes. The source bank is evenly distributed across the three DP-700 domains: Implement and manage an analytics solution: 350 questions, Ingest and transform data: 350 questions, Monitor and optimize an analytics solution: 350 questions. Use this file as a fast, scenario-focused study guide, not as a question-by-question summary.
1. Exam Overview
What the exam is testing
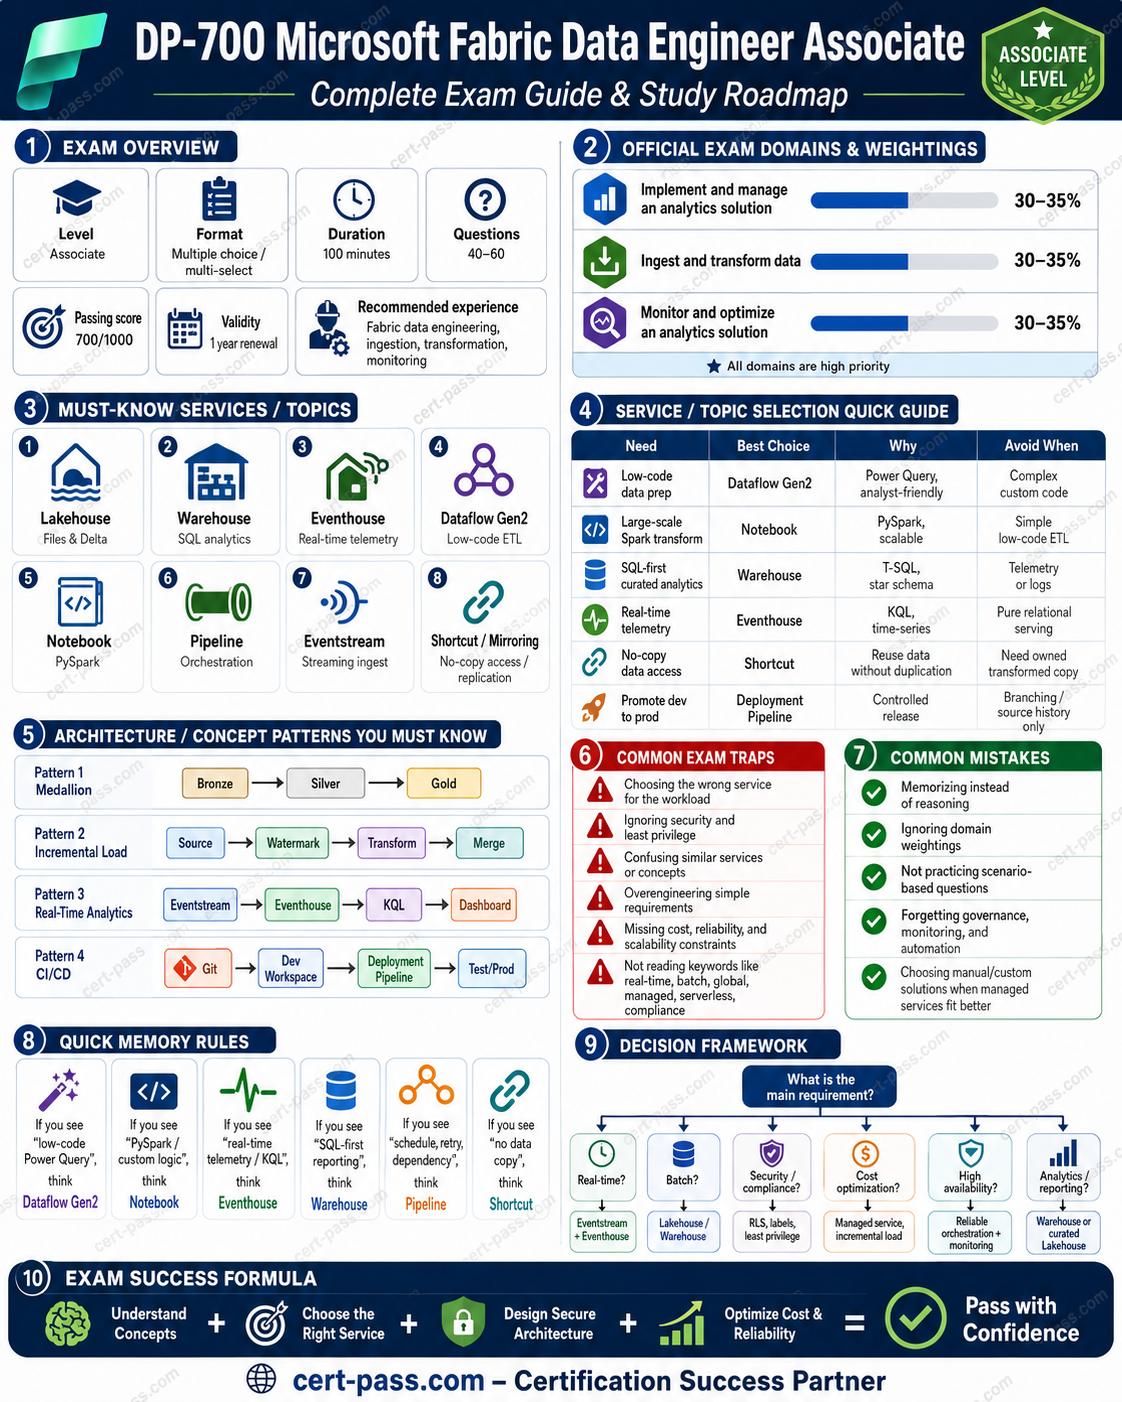
DP-700 validates whether you can implement data engineering solutions in Microsoft Fabric. The exam is not just about knowing product names. It tests whether you can choose the right Fabric item, loading pattern, transformation engine, security model, monitoring approach, and optimization technique for a realistic enterprise analytics scenario.
You are expected to reason across:
- Workspaces and lifecycle: Git integration, deployment pipelines, environments, item promotion, workspace settings, domains, capacity, and governance.
- Data engineering implementation: lakehouses, warehouses, Eventhouses, Eventstreams, Dataflows Gen2, notebooks, pipelines, KQL, T-SQL, PySpark, shortcuts, mirroring, batch and streaming ingestion.
- Operations and performance: troubleshooting pipelines, notebooks, Dataflows Gen2, Eventstreams, Eventhouses, OneLake shortcuts, semantic model refresh, Spark jobs, warehouse queries, and capacity issues.
How to think like the exam
The exam usually gives you a business or technical constraint and asks for the best Fabric-native choice. Do not choose the tool you personally prefer. Choose the tool that best matches the scenario constraints.
Typical exam logic:
- Identify the data shape: batch, streaming, relational, files, telemetry, dimensional model, or operational replication.
- Identify the user persona: data engineer, low-code analyst, SQL developer, real-time analyst, BI consumer, administrator.
- Identify operational constraints: CI/CD, governance, security, monitoring, cost, performance, incremental load, late-arriving data, or schema evolution.
- Eliminate attractive but wrong options: wrong engine, wrong security layer, wrong optimization level, or manual approach when Fabric has a managed feature.
- Prefer the simplest Fabric-native solution that satisfies all requirements.
How to use this course
Read sections 1-3 first, then study sections 4-8 by scenario. For final review, use sections 9-10. When practicing questions, map every question to one of these decisions:
- Which Fabric item should be used?
- Which transformation engine is best?
- Which security boundary applies?
- Which monitoring signal identifies the problem?
- Which optimization action fixes the bottleneck?
2. Exam Domains
| Official domain | Weight | What matters most | Source-bank emphasis |
|---|---|---|---|
| Implement and manage an analytics solution | 30-35% | Workspace settings, lifecycle management, security, governance, orchestration | 350 questions |
| Ingest and transform data | 30-35% | Batch and streaming ingestion, transformation engines, loading patterns, OneLake, shortcuts, mirroring | 350 questions |
| Monitor and optimize an analytics solution | 30-35% | Monitoring, troubleshooting, semantic refresh, pipeline/notebook/Eventhouse errors, performance tuning | 350 questions |
Priority notes
All three DP-700 domains have similar weights. The practical priority is:
- Ingest and transform data - this is where many scenario questions hide the service-selection decision.
- Implement and manage analytics solutions - governance, CI/CD, access control, and orchestration are frequent traps.
- Monitor and optimize analytics solutions - questions often test the exact diagnostic surface or optimization action.
What matters most
Know how to distinguish these pairs quickly:
- Dataflow Gen2 vs notebook vs pipeline vs T-SQL vs KQL.
- Lakehouse vs warehouse vs Eventhouse.
- Shortcut vs copy vs mirroring.
- Full load vs incremental load vs streaming load.
- Workspace role vs item permission vs OneLake security vs SQL security.
- Deployment pipeline vs Git integration.
- Pipeline failure vs notebook failure vs Dataflow Gen2 refresh failure vs semantic model refresh failure.
- Spark optimization vs warehouse query optimization vs Eventhouse/KQL optimization.
3. Start-to-Finish Study Path
Foundation: understand the Fabric data platform
Start with the Fabric object model:
- Workspace: collaboration and security boundary for Fabric items.
- OneLake: tenant-wide data lake foundation.
- Lakehouse: file/table-oriented engineering store backed by Delta tables and Spark.
- Warehouse: relational SQL analytics store for T-SQL developers and dimensional workloads.
- Eventhouse: real-time analytics store optimized for event/telemetry data and KQL.
- Data pipeline: orchestration, movement, scheduling, dependencies, parameters.
- Dataflow Gen2: low-code/no-code Power Query-based ingestion and transformation.
- Notebook: PySpark/SQL code-first transformation and engineering.
- Eventstream: real-time event ingestion and routing.
Foundation goal: when you see a requirement, you should immediately know the most likely Fabric item.
Intermediate: master ingestion and transformation decisions
Study these loading patterns:
- Full load for small or replaceable data.
- Incremental load with watermark for large changing data.
- Change data capture or mirroring when operational replication is required.
- Streaming ingestion for continuous events.
- Bronze/Silver/Gold pattern for lakehouse engineering.
- Dimensional modeling preparation for warehouse or BI consumption.
Intermediate goal: explain why one engine is better than another for a given scenario.
Advanced: governance, CI/CD, orchestration, and reliability
Focus on:
- Git integration for version control and pull-request workflows.
- Deployment pipelines for controlled promotion across dev/test/prod.
- Workspace roles and item permissions.
- Row-level, column-level, object-level, folder/file-level, and OneLake security.
- Sensitivity labels and endorsement.
- Fabric audit logs.
- Pipelines with parameters, dynamic expressions, retries, schedules, and event triggers.
Advanced goal: design a production-ready solution, not just a working data load.
Final review: monitoring and optimization
Practice recognizing symptoms:
- Slow Spark notebook: partitioning, shuffle, skew, file size, caching, job metrics.
- Slow warehouse query: statistics, distribution of joins, indexing/physical design where applicable, query plan, materialization strategy.
- Lakehouse table issue: Delta maintenance, compaction, vacuum retention, file layout.
- Pipeline failure: activity output, dependency, parameter, linked connection, schema drift, permission.
- Eventstream/Eventhouse issue: ingestion errors, schema mapping, retention, KQL function/windowing, throughput.
Final goal: when a question describes a failure, know where to look first and which fix is targeted.
4. Core Concepts by Domain
Domain 1: Implement and manage an analytics solution
Concepts
This domain tests whether you can configure and manage Fabric solutions as enterprise assets. It is not only about creating lakehouses or notebooks; it is about controlling how they are secured, promoted, governed, and orchestrated.
Key concepts:
- Workspace configuration for Spark, domains, OneLake, and Dataflows Gen2.
- Version control and collaboration with Git integration.
- Controlled deployment with deployment pipelines.
- Database projects for warehouse development lifecycle.
- Workspace-level and item-level access control.
- SQL security and OneLake security.
- Sensitivity labels, endorsement, and audit logs.
- Orchestration with pipelines, notebooks, parameters, dynamic expressions, schedules, and event triggers.
Services
| Need | Best Fabric choice | Why |
|---|---|---|
| Branching, pull requests, rollback | Git integration | Source-control workflow for collaboration and change history |
| Promote items from dev to test to prod | Deployment pipeline | Environment promotion, comparison, deployment rules |
| Schedule multi-step workloads | Data pipeline | Orchestration, dependencies, parameters, retry logic |
| Run complex code transformations | Notebook | PySpark/SQL code, reusable logic, engineering flexibility |
| Low-code transformation | Dataflow Gen2 | Power Query experience and managed refresh |
| Govern data classification | Sensitivity labels | Applies classification and protection metadata |
| Certify trusted assets | Endorsement | Helps users identify promoted/certified content |
| Investigate user/admin activity | Audit logs | Trace actions and governance events |
Patterns
- Use Git integration for developer collaboration; use deployment pipelines for release promotion.
- Use workspace roles for broad collaboration access; use item permissions for specific artifacts.
- Use SQL row/column/object-level security for SQL access patterns; use OneLake security for file/folder/table access patterns in OneLake.
- Use pipelines as the orchestrator and call notebooks, Dataflows Gen2, copy activities, or stored procedures as steps.
- Use parameters and dynamic expressions to avoid hardcoding paths, dates, workspace names, and environment values.
Traps
- Choosing Git integration when the requirement is environment promotion and approvals. Correct answer is usually deployment pipeline.
- Choosing deployment pipeline when the requirement is pull requests and branch history. Correct answer is usually Git integration.
- Choosing workspace Admin when the user only needs to read one item. Prefer least privilege.
- Applying sensitivity labels when the requirement is to restrict rows. Sensitivity labels classify; they do not replace row-level security.
- Using a notebook as the orchestrator when the requirement is scheduling, dependency management, retries, and monitoring. Pipelines are usually the orchestrator.
Domain 2: Ingest and transform data
Concepts
This is the largest practical part of the exam because it tests service selection. The same data can often be transformed by Dataflows Gen2, notebooks, T-SQL, KQL, or pipelines. The exam wants the best fit.
Key concepts:
- Full, incremental, and streaming loading patterns.
- Watermark-based incremental ingestion.
- Dimensional model preparation.
- Lakehouse, warehouse, and Eventhouse selection.
- OneLake shortcuts versus physical copy.
- Mirroring for operational data replication.
- Batch ingestion with pipelines.
- Transformations using PySpark, SQL, and KQL.
- Handling duplicates, missing values, and late-arriving data.
- Eventstreams, Spark structured streaming, KQL processing, and windowing functions.
Services
| Need | Best choice | Why |
|---|---|---|
| Large-scale file/table transformation | Notebook with Spark | Scalable, code-first, complex transformations |
| Low-code ingestion/transformation | Dataflow Gen2 | Power Query, accessible for analysts, managed refresh |
| SQL transformation in warehouse | T-SQL | Relational logic, dimensional models, SQL developer workflow |
| Real-time telemetry analysis | Eventhouse + KQL | Optimized for event/time-series analytics |
| Real-time ingestion/routing | Eventstream | Event capture, routing, filtering, stream processing entry point |
| Orchestrate copy and transformations | Pipeline | Scheduling and dependencies across steps |
| Access data without copying | OneLake shortcut | Virtual access to data in another location |
| Replicate operational data | Mirroring | Near real-time replication with less custom ETL |
| Handle continuously arriving data in Spark | Spark structured streaming | Code-based stream processing |
Patterns
- Use watermarks for incremental batch loads. Store the last successful load timestamp or key.
- Use deduplication keys and event time when duplicate or late-arriving records are possible.
- Use Eventstream to ingest and route events; use Eventhouse/KQL to query and analyze event data.
- Use shortcuts when data should remain in place and be accessed through OneLake.
- Use copy/movement when you need physical control, transformation during landing, or isolation from source changes.
- Use mirroring when the requirement is operational database replication into Fabric with minimal ETL.
- Use lakehouse for engineering and open data layout; use warehouse for SQL-first curated analytics and dimensional modeling.
Traps
- Choosing a warehouse for raw semi-structured file engineering when a lakehouse/notebook pattern fits better.
- Choosing a notebook for simple low-code transformation when Dataflow Gen2 is enough and maintainable by analysts.
- Choosing Dataflow Gen2 for very complex PySpark logic, custom libraries, or distributed code workflows. Use notebooks.
- Choosing a shortcut when the requirement says transform and store a curated copy. Shortcut is access, not transformation.
- Choosing full load for large frequently changing data. Incremental with watermark is preferred.
- Ignoring late-arriving data in streaming questions. Use event-time windowing and proper watermarking logic.
Domain 3: Monitor and optimize an analytics solution
Concepts
This domain tests operational judgment. The exam often describes symptoms and asks what you should inspect or optimize.
Key concepts:
- Monitoring ingestion, transformation, and semantic model refresh.
- Pipeline run history, activity output, retries, and dependency diagnostics.
- Dataflow Gen2 refresh errors and transformation-step issues.
- Notebook execution errors, Spark job metrics, logs, and resource bottlenecks.
- Eventstream and Eventhouse ingestion/query errors.
- T-SQL error diagnosis and warehouse query tuning.
- OneLake shortcut errors caused by path, permission, source availability, or schema issues.
- Lakehouse table optimization, compaction, vacuuming, and query layout.
- Spark performance tuning: partitions, skew, shuffle, caching, file sizes.
- Warehouse and KQL query optimization.
Services and diagnostics
| Symptom | First place to inspect | Likely fix |
|---|---|---|
| Pipeline activity failed | Pipeline run details and activity output | Correct parameter, connection, dependency, schema, or permission |
| Notebook runs slowly | Spark UI/job metrics/logs | Reduce shuffle, repartition, handle skew, cache selectively |
| Lakehouse table has many small files | Lakehouse/Delta optimization tools | Compact/optimize table and manage retention carefully |
| Dataflow Gen2 refresh fails | Dataflow refresh history and step errors | Fix transformation step, schema mismatch, credentials, or destination mapping |
| Semantic model refresh fails | Refresh history and data source credentials | Fix credentials, gateway/connection, capacity, or upstream data availability |
| Eventhouse ingestion fails | Ingestion diagnostics and mappings | Fix schema mapping, format, batching, retention, or permission |
| KQL query slow | Query diagnostics and KQL design | Filter early, reduce scanned data, use time filters, summarize efficiently |
| Warehouse query slow | Query plan/performance view | Reduce scans, improve joins, update statistics/materialize where appropriate |
| Shortcut broken | Shortcut target and permissions | Fix source path, credentials, permissions, or source availability |
Patterns
- Diagnose before optimizing. The exam often rewards the answer that checks the specific run details or metrics first.
- For Spark, think: shuffle, partitions, skew, cache, file size.
- For lakehouse Delta tables, think: optimize/compact, vacuum carefully, partition wisely.
- For streaming, think: throughput, schema mapping, event-time windows, late data, retention.
- For pipelines, think: activity output, dependencies, retry policy, parameters, connections.
- For semantic model refresh, think: upstream availability, credentials, capacity, refresh history.
Traps
- Restarting capacity before checking run-level diagnostics. Capacity can be relevant, but exam questions often expect targeted troubleshooting first.
- Vacuuming as a universal fix. Vacuum removes old files; it can break time travel if retention is too aggressive.
- Partitioning by high-cardinality columns. It can create too many small files.
- Caching everything in Spark. Cache only reused intermediate data; otherwise it wastes memory.
- Optimizing the wrong layer: Spark tuning will not fix a SQL warehouse query plan problem, and warehouse tuning will not fix Eventhouse ingestion mapping.
5. Service Selection Guide
Lakehouse vs Warehouse vs Eventhouse
| Requirement | Lakehouse | Warehouse | Eventhouse |
|---|---|---|---|
| Primary persona | Data engineers, Spark users | SQL developers, BI/analytics engineers | Real-time analytics engineers |
| Best for | Files, Delta tables, medallion engineering, Spark transformations | Relational analytics, dimensional models, SQL serving | Telemetry, logs, events, time-series analytics |
| Main languages | PySpark, SQL, notebooks | T-SQL | KQL |
| Data style | Open lake data, tables and files | Structured relational tables | High-volume event data |
| Common exam clue | “raw/curated files,” “Spark,” “Delta,” “engineering pipeline” | “SQL-first,” “star schema,” “warehouse,” “T-SQL” | “telemetry,” “logs,” “real-time,” “KQL,” “Eventstream” |
| Avoid when | Requirement is purely relational SQL warehouse serving | Requirement needs open Spark/file processing | Requirement is batch dimensional warehouse only |
Dataflow Gen2 vs Notebook vs Pipeline
| Requirement | Dataflow Gen2 | Notebook | Pipeline |
|---|---|---|---|
| Main role | Low-code transform | Code-first transform | Orchestration/control flow |
| Best for | Power Query transformations, analyst-friendly ETL | PySpark/SQL transformations, complex logic, scalable processing | Scheduling, dependencies, parameters, retries, multi-step workflows |
| Not best for | Heavy custom code or complex distributed algorithms | Simple low-code transformations owned by business users | Complex row-by-row transformation logic by itself |
| Exam clue | “low-code,” “Power Query,” “business analyst can maintain” | “PySpark,” “custom logic,” “large-scale transform” | “schedule,” “trigger,” “dependency,” “retry,” “parameterize” |
Shortcut vs Copy vs Mirroring
| Requirement | Shortcut | Copy/ingest | Mirroring |
|---|---|---|---|
| What it does | References data in place | Physically moves data | Replicates supported operational sources |
| Best when | Avoid duplication; access external/internal data through OneLake | Need curated copy, transformation, isolation, or controlled landing | Need near real-time operational database replication with minimal ETL |
| Main trap | It does not transform or own the data | Can duplicate data and add latency | Not a generic replacement for all ETL |
| Exam clue | “no copy,” “single copy,” “access data where it resides” | “land data,” “transform,” “store curated version” | “replicate operational database,” “minimal ETL,” “near real-time” |
Batch vs Streaming transformation
| Scenario | Preferred approach | Why |
|---|---|---|
| Nightly load from CRM | Pipeline + Dataflow Gen2/notebook/T-SQL | Batch orchestration with scheduled dependency |
| Large data lake transformation | Notebook with Spark | Distributed processing and engineering flexibility |
| SQL dimensional load | Warehouse + T-SQL | SQL-native modeling and serving |
| IoT events in near real time | Eventstream + Eventhouse/KQL | Event ingestion and time-series querying |
| Continuous stream with custom logic | Spark structured streaming | Code-first streaming transformation |
| Incremental source table load | Pipeline with watermark | Avoids reprocessing all data |
Security and governance selection
| Requirement | Best mechanism | Avoid confusing with |
|---|---|---|
| Give user broad workspace collaboration | Workspace role | Item permission |
| Give access to one specific artifact | Item permission | Workspace Admin role |
| Restrict rows by user | Row-level security | Sensitivity label |
| Hide sensitive columns | Column-level security or masking | Workspace role |
| Protect/classify confidential data | Sensitivity label | RLS/CLS |
| Mark trusted content | Endorsement/certification | Security permission |
| Audit actions | Fabric audit logs | Refresh history only |
| Control OneLake file/table access | OneLake security | SQL-only permission |
6. Architecture Patterns
Pattern 1: Enterprise medallion lakehouse
Scenario: Raw files arrive from multiple sources. Engineers need scalable transformations and curated tables for analytics.
Recommended solution:
- Land raw data in a lakehouse bronze area.
- Use notebooks/Spark for cleansing, deduplication, schema handling, and enrichment.
- Store curated silver/gold Delta tables.
- Orchestrate with pipelines.
- Use deployment pipelines and Git for lifecycle.
- Apply OneLake security, item permissions, labels, and audit monitoring.
Why alternatives are wrong:
- Warehouse-only is less suitable for raw file engineering and Spark-heavy transformations.
- Dataflow Gen2-only may be too limited for complex distributed transformation logic.
- Manual scheduling without pipelines weakens operational reliability.
Pattern 2: SQL-first warehouse analytics
Scenario: A team needs relational curated tables, dimensional models, and T-SQL transformations for BI.
Recommended solution:
- Use Fabric Warehouse for curated relational storage.
- Use T-SQL for transformations and dimensional modeling.
- Use pipelines for orchestration.
- Use database projects and deployment pipelines for lifecycle.
- Tune queries using query diagnostics, statistics, efficient joins, and materialization where appropriate.
Why alternatives are wrong:
- Eventhouse is optimized for events/logs, not classic dimensional warehouse workloads.
- Lakehouse can serve SQL analytics, but warehouse is usually stronger when the scenario is SQL-first and relational.
Pattern 3: Real-time telemetry analytics
Scenario: IoT devices, logs, or application telemetry arrive continuously and analysts need near real-time exploration.
Recommended solution:
- Use Eventstream for ingestion and routing.
- Use Eventhouse for storage and KQL analysis.
- Use KQL windowing and time filters for event analysis.
- Monitor ingestion failures, schema mappings, retention, and throughput.
Why alternatives are wrong:
- A nightly pipeline is not enough for real-time requirements.
- Warehouse is not the primary engine for high-volume event/time-series analytics.
- Shortcuts alone do not process streaming events.
Pattern 4: Incremental batch ingestion
Scenario: A source table is large and only changed rows should be processed each run.
Recommended solution:
- Store a watermark value such as last modified timestamp or increasing key.
- Use a pipeline parameter to pass the watermark.
- Ingest only new/changed records.
- Update the watermark only after a successful load.
- Handle duplicates and late-arriving data with merge/upsert logic.
Why alternatives are wrong:
- Full reload wastes time and capacity.
- Updating the watermark before successful processing risks data loss.
- Relying only on ingestion time can miss late-arriving source records.
Pattern 5: Dev/test/prod lifecycle
Scenario: A team needs controlled release of Fabric items across environments.
Recommended solution:
- Use Git integration for source control in development.
- Use deployment pipelines to promote items from dev to test to prod.
- Use deployment rules and parameters to adjust environment-specific values.
- Use approvals and validation before production deployment.
Why alternatives are wrong:
- Git alone does not replace environment promotion.
- Manually recreating items increases drift and errors.
- Giving everyone Admin rights violates least privilege.
Pattern 6: Data access without duplication
Scenario: Data already exists in another lake/storage location and should be used in Fabric without copying.
Recommended solution:
- Create a OneLake shortcut.
- Ensure source permissions and path configuration are correct.
- Apply governance and security appropriate to the consuming workspace/item.
Why alternatives are wrong:
- Copying duplicates data and can introduce synchronization problems.
- Mirroring is for supported operational replication, not generic “access this file location without copying.”
7. Exam Traps
Misleading wording patterns
| If the question says... | Think... | Avoid... |
|---|---|---|
| “Promote from dev to test to prod” | Deployment pipeline | Git as the only answer |
| “Pull requests, branches, rollback” | Git integration | Deployment pipeline only |
| “Low-code Power Query” | Dataflow Gen2 | Notebook unless complex code is required |
| “Custom PySpark logic” | Notebook | Dataflow Gen2 |
| “Schedule, retry, dependency” | Pipeline | Notebook as orchestrator |
| “Telemetry/logs/time-series/KQL” | Eventhouse | Warehouse |
| “Continuous events” | Eventstream | Batch pipeline |
| “No data duplication” | Shortcut | Copy activity |
| “Replicate operational database” | Mirroring | Shortcut or manual ETL by default |
| “Restrict rows” | Row-level security | Sensitivity label |
| “Classify confidential content” | Sensitivity label | RLS |
| “Trusted/certified content” | Endorsement | Security permission |
| “Slow Spark job” | Spark metrics, partitioning, shuffle, skew | Warehouse tuning |
| “Many small Delta files” | Optimize/compact table | Add more partitions blindly |
Wrong-but-plausible answers
- Workspace Admin for everything: plausible because it grants access, wrong because it violates least privilege.
- Full refresh for reliability: plausible because it is simple, wrong for large or frequent data changes.
- Notebook for all transformations: plausible for engineers, wrong when low-code maintainability or orchestration is the requirement.
- Pipeline for transformation logic: plausible because pipelines move data, wrong when complex transformation belongs in notebook, Dataflow Gen2, SQL, or KQL.
- Shortcut for ETL: plausible because it exposes data, wrong because it does not transform data.
- Vacuum for performance: plausible because it is a Delta maintenance command, wrong when the issue is small files or query layout; vacuum removes obsolete files.
- KQL for warehouse dimensional models: plausible because it queries data, wrong when relational warehouse/T-SQL is the scenario.
Elimination strategy
Use this fast elimination sequence:
- Is it batch or streaming? If streaming, eliminate warehouse-only and nightly-only answers unless the question says downstream batch analytics.
- Is the requirement orchestration or transformation? If orchestration, choose pipeline. If transformation, choose the correct engine.
- Is the persona low-code or code-first? Low-code points to Dataflow Gen2; code-first points to notebook/T-SQL/KQL.
- Is the data relational, file/lake, or telemetry? Relational = warehouse/T-SQL; file/lake = lakehouse/Spark; telemetry = Eventhouse/KQL.
- Is the issue security, classification, or trust? Restrict = permissions/RLS/CLS/OneLake security; classify = sensitivity label; trust = endorsement.
- Is the question asking for diagnosis or fix? If diagnosis, inspect logs/run details/metrics first; if fix, apply the targeted optimization.
8. Quick Memory Rules
Rules of thumb
- Pipeline orchestrates; notebook transforms.
- Dataflow Gen2 is low-code; notebook is code-first.
- Warehouse is SQL-first; lakehouse is engineering-first; Eventhouse is real-time/KQL-first.
- Shortcut accesses data; copy owns a copy; mirroring replicates supported sources.
- Git controls source; deployment pipeline controls environment promotion.
- Workspace roles are broad; item permissions are specific.
- Sensitivity labels classify; RLS/CLS restrict.
- Endorsement builds trust; it does not secure data.
- Audit logs tell who did what; refresh history tells what ran and failed.
- Optimize small files with compaction; do not over-partition.
- Use watermarks for incremental loads; update them after success.
- For late events, think event time and windowing.
Fast service mapping
| If you see... | Think... |
|---|---|
| Power Query, business analyst, low-code | Dataflow Gen2 |
| PySpark, custom code, distributed transform | Notebook |
| Schedule, trigger, retry, dependency | Pipeline |
| SQL warehouse, dimensions, facts | Warehouse + T-SQL |
| Logs, telemetry, events, KQL | Eventhouse |
| Streaming ingestion/routing | Eventstream |
| Access without copy | OneLake shortcut |
| Operational replication | Mirroring |
| Dev/test/prod promotion | Deployment pipeline |
| Branching and PR workflow | Git integration |
| Confidential classification | Sensitivity label |
| Certified trusted data product | Endorsement |
| Row filtering by user | Row-level security |
| Slow Spark transform | Spark UI/job metrics, partitioning, shuffle |
| Broken shortcut | Target path, source availability, credentials, permissions |
Quick decision frameworks
Transformation engine framework
- Use Dataflow Gen2 when the transformation is low-code and maintainable by analysts.
- Use Notebook/Spark when the transformation is large, complex, code-based, or needs custom libraries.
- Use T-SQL when the data is in a warehouse and the workload is relational/dimensional.
- Use KQL when the data is event/time-series/log oriented.
- Use Pipeline to coordinate these steps, not to replace them.
Security framework
- Need broad collaboration? Workspace role.
- Need access to one item? Item permission.
- Need row filtering? RLS.
- Need column hiding? CLS or masking.
- Need file/table access in OneLake? OneLake security.
- Need classification? Sensitivity label.
- Need trust/certification? Endorsement.
- Need traceability? Audit logs.
Performance framework
- Lakehouse table slow due to files: compact/optimize and review partitioning.
- Spark job slow: inspect Spark metrics, reduce shuffle, fix skew, tune partitions.
- Warehouse query slow: inspect query plan, reduce scans, optimize joins, statistics/materialization.
- Eventhouse query slow: filter by time early, summarize efficiently, reduce scanned extents.
- Pipeline slow: parallelize independent activities, avoid unnecessary copies, tune source/sink settings.
9. Final Revision Notes
Highest-yield review points
- Know the three DP-700 domains and that they are evenly weighted.
- Be able to choose between lakehouse, warehouse, and Eventhouse in less than 10 seconds.
- Be able to choose between Dataflow Gen2, notebook, pipeline, T-SQL, and KQL.
- Understand full vs incremental vs streaming load patterns.
- Remember that a pipeline is mainly for orchestration, not complex transformation logic.
- Remember that Git and deployment pipelines solve different lifecycle problems.
- Know access-control layers: workspace, item, SQL security, OneLake security, and labels.
- Know how to diagnose failures by Fabric item type.
- Know the top performance fixes for Spark, lakehouse Delta tables, warehouse queries, and KQL/Eventhouse queries.
- Be careful with least privilege and avoid over-granting Admin roles.
Last-day revision list
Review these in order:
- Service-selection tables in section 5.
- Architecture patterns in section 6.
- Trap table in section 7.
- Quick service mapping in section 8.
- Monitoring symptoms and first diagnostic action in Domain 3.
- Incremental load and watermark rules.
- Security and governance mapping.
- Lifecycle mapping: Git vs deployment pipeline vs database project.
Mini scenario examples
Example 1: A business analyst must transform CSV data using a visual interface and schedule refreshes.
Answer logic: Dataflow Gen2 is better than a notebook because the requirement emphasizes low-code maintainability.
Example 2: A Spark notebook takes too long after joining a very large table with a small reference table.
Answer logic: Inspect Spark job metrics and consider join/shuffle optimization. Warehouse tuning is the wrong layer.
Example 3: A team wants to use source data in another workspace without physically copying it.
Answer logic: OneLake shortcut is the best fit. Copy activity duplicates data; mirroring is for operational replication scenarios.
Example 4: A production deployment must promote notebooks and pipelines from test to prod with environment-specific values.
Answer logic: Deployment pipeline with rules/parameters. Git helps with source control, but does not replace promotion.
10. Exam-Day Checklist
Must-know topics
- Official DP-700 domains and equal weighting range: 30-35% each.
- Workspace configuration: Spark, domain, OneLake, Dataflows Gen2 settings.
- Git integration vs deployment pipelines.
- Database projects for warehouse lifecycle.
- Workspace roles vs item permissions.
- RLS, CLS, object-level security, dynamic masking, file/folder/table security.
- Sensitivity labels, endorsement, and audit logs.
- Pipeline scheduling, event triggers, parameters, dynamic expressions, retries.
- Full, incremental, and streaming loading patterns.
- Watermarks and late-arriving data handling.
- Dataflow Gen2 vs notebook vs T-SQL vs KQL.
- Lakehouse vs warehouse vs Eventhouse.
- OneLake shortcuts vs copy vs mirroring.
- Eventstreams, Eventhouse, KQL, windowing functions.
- Spark structured streaming use cases.
- Monitoring pipeline, notebook, Dataflow Gen2, Eventstream, Eventhouse, T-SQL, and shortcut errors.
- Lakehouse table optimization, compaction, partitioning, and vacuum caution.
- Spark performance: partitions, skew, shuffle, caching, file sizes.
- Warehouse query performance: plans, scans, joins, statistics/materialization.
- KQL/Eventhouse performance: time filtering, summarization, ingestion mapping, retention.
Final confidence checklist
Before the exam, you should be able to answer these without notes:
- When should I use a lakehouse instead of a warehouse?
- When should I use Eventhouse instead of warehouse or lakehouse?
- When is a shortcut better than copy activity?
- When is mirroring the best answer?
- When is a pipeline the answer and when is a notebook the answer?
- What is the first thing to inspect when a pipeline fails?
- What is the first thing to inspect when a notebook is slow?
- Which feature promotes Fabric items between dev/test/prod?
- Which feature supports pull requests and source history?
- Which security feature restricts rows?
- Which feature classifies confidential content?
- Which optimization fixes many small files?
- Why can over-partitioning hurt performance?
- Why should a watermark be updated only after successful load?
Final exam mindset
DP-700 rewards practical engineering judgment. In most questions, two answers will look possible. Choose the one that best fits the exact constraint in the wording:
- Need orchestration? Pipeline.
- Need complex Spark transformation? Notebook.
- Need low-code transformation? Dataflow Gen2.
- Need SQL dimensional analytics? Warehouse.
- Need real-time event analytics? Eventhouse/KQL.
- Need no-copy access? Shortcut.
- Need operational replication? Mirroring.
- Need environment promotion? Deployment pipeline.
- Need version-control collaboration? Git integration.
- Need classify data? Sensitivity label.
- Need restrict data? Security rule/permission.
If an answer is too broad, too manual, or grants too much access, it is usually a trap.
FAQ
What should be learned first?
Start with the official facts, the service families, and the service selection pairs that are easiest to confuse. Use /exams/azure-dp-700-microsoft-fabric-data-engineer-associate as the home base for practice and revision.
Is the official vendor page useful?
Yes. It provides the vendor baseline for what the certification covers and helps anchor the study plan to official wording.
Final CTA
Return to /exams/azure-dp-700-microsoft-fabric-data-engineer-associate whenever you need a clean reset before practice or final revision.